How to read an AML4Tracker PDF report
A saved view of the information available for a wallet check. Read the score together with its supporting details and coverage limits.
Educational example - entirely synthetic data
Every value, identifier, entity and path below is fabricated for education. No real wallet was scanned. This sample does not demonstrate an active Free product.
The sample PDF and report images on this page are in English; the explanations and equivalent HTML tables are in English.
Page 1
1. Risk score
Synthetic report example - no real scan
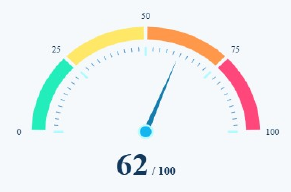
The sample shows 62 out of 100, labelled High. The label is an application risk band, not a 62% probability of crime. Neither the score nor the label establishes ownership or wrongdoing.
Page 1
2. Wallet overview and report details
Synthetic report example - no real scan
Verified asset value (USD)
$1,250.00
Required responses: complete. Asset data coverage: limited.
Read the synthetic data as an HTML table
Entirely synthetic educational data, matching this sample PDF. The unavailable history fields are omitted in the PDF. Percentages have an unknown calculation basis.
| Field | Value |
|---|---|
| Address | DEMO-EVM-WALLET-NOT-AN-ADDRESS |
| Report ID | DEMO-REPORT-0001 |
| Scan time (UTC) | 2000-01-01T12:00:00.000Z |
| PDF created (UTC) | 2026-10-25 12:03:20 UTC |
| Risk score | 62 / 100 |
| Verified asset value (USD) | $1,250.00 |
| Total received | Unavailable - omitted in the PDF |
| Total sent | Unavailable - omitted in the PDF |
| Transaction count | Unavailable - omitted in the PDF |
The illustrative $1,250 verified asset value covers verified assets with available prices across Ethereum and BNB Smart Chain. It is not a promise to include every asset or the full wallet history. The address, report ID and scan time identify this synthetic example; REPORT GENERATED is the later PDF export time. Received value, sent value and transaction count are unavailable here and are omitted rather than replaced with zeros.
Page 2
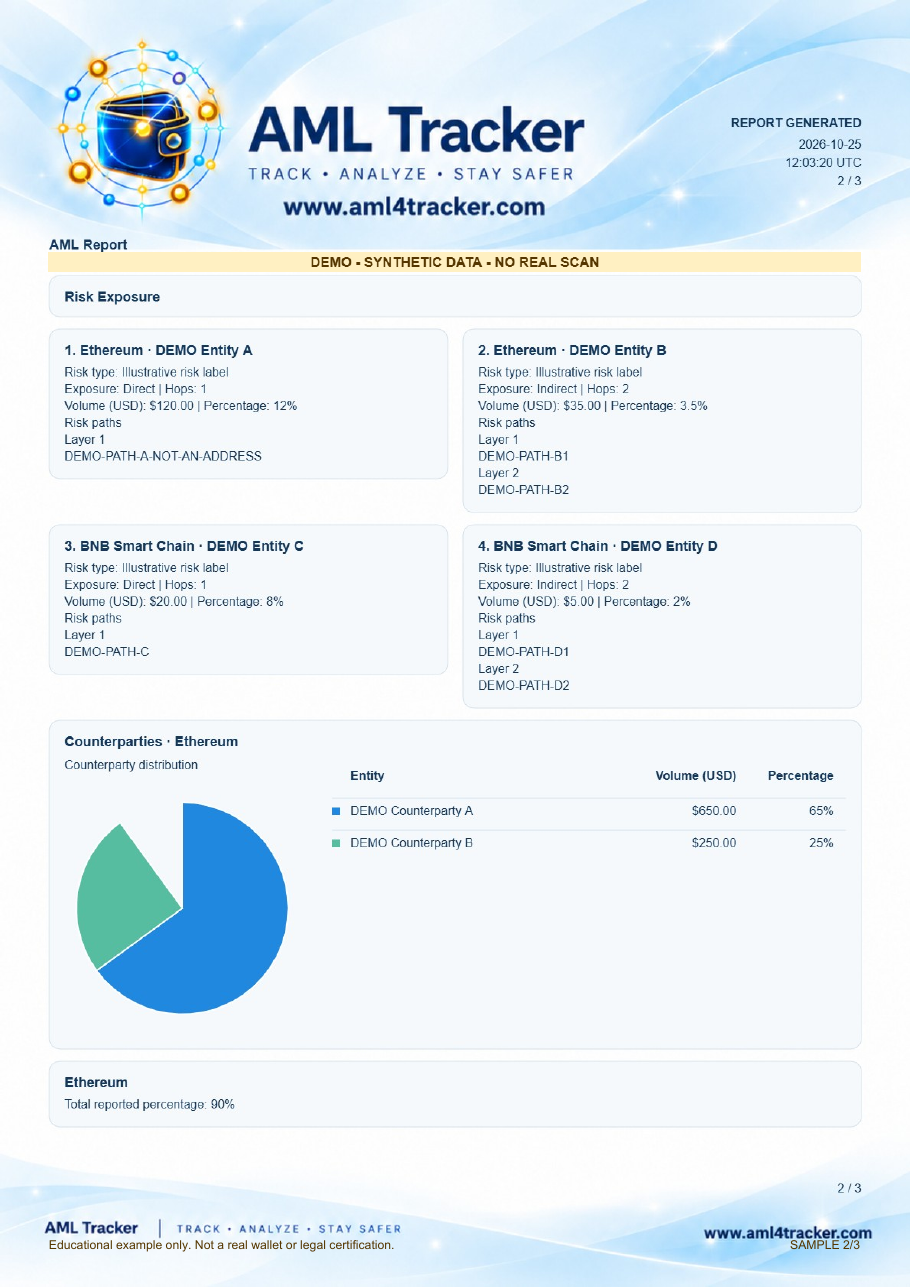
3. Risk exposure
Synthetic report example - no real scan
Ethereum · DEMO Entity A
- Risk type
- Illustrative risk label
- Exposure
- Direct
- Hops
- 1
- Volume (USD)
- $120.00
- Reported percentage
- 12%
Risk paths
- Layer 1
DEMO-PATH-A-NOT-AN-ADDRESS
Ethereum · DEMO Entity B
- Risk type
- Illustrative risk label
- Exposure
- Indirect
- Hops
- 2
- Volume (USD)
- $35.00
- Reported percentage
- 3.5%
Risk paths
- Layer 1
DEMO-PATH-B1 - Layer 2
DEMO-PATH-B2
BNB Smart Chain · DEMO Entity C
- Risk type
- Illustrative risk label
- Exposure
- Direct
- Hops
- 1
- Volume (USD)
- $20.00
- Reported percentage
- 8%
Risk paths
- Layer 1
DEMO-PATH-C
BNB Smart Chain · DEMO Entity D
- Risk type
- Illustrative risk label
- Exposure
- Indirect
- Hops
- 2
- Volume (USD)
- $5.00
- Reported percentage
- 2%
Risk paths
- Layer 1
DEMO-PATH-D1 - Layer 2
DEMO-PATH-D2
Read the synthetic data as an HTML table
Entirely synthetic educational data, matching this sample PDF. The unavailable history fields are omitted in the PDF. Percentages have an unknown calculation basis.
| Entity | Network | Risk type | Exposure | Hops | Volume (USD) | Reported percentage | Risk paths |
|---|---|---|---|---|---|---|---|
| DEMO Entity A | Ethereum | Illustrative risk label | Direct | 1 | $120.00 | 12% |
|
| DEMO Entity B | Ethereum | Illustrative risk label | Indirect | 2 | $35.00 | 3.5% |
|
| DEMO Entity C | BNB Smart Chain | Illustrative risk label | Direct | 1 | $20.00 | 8% |
|
| DEMO Entity D | BNB Smart Chain | Illustrative risk label | Indirect | 2 | $5.00 | 2% |
|
The four fictional rows illustrate a risk label, direct or indirect relation, hop count, USD volume, reported percentage and available layer paths. Direct and indirect describe the reported relationship. A layer path is not a transaction receipt or proof of wrongdoing. All four rows are included in the PDF, even when the web report initially shows fewer rows.
Pages 2 and 3
4. Counterparties
Synthetic report example - no real scan
Ethereum
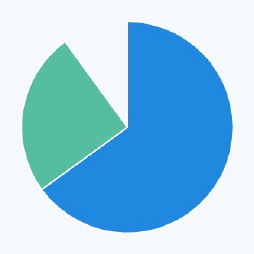
| Entity | Volume (USD) | Reported percentage |
|---|---|---|
| DEMO Counterparty A | $650.00 | 65% |
| DEMO Counterparty B | $250.00 | 25% |
| Sum of reported percentages | 90% | |
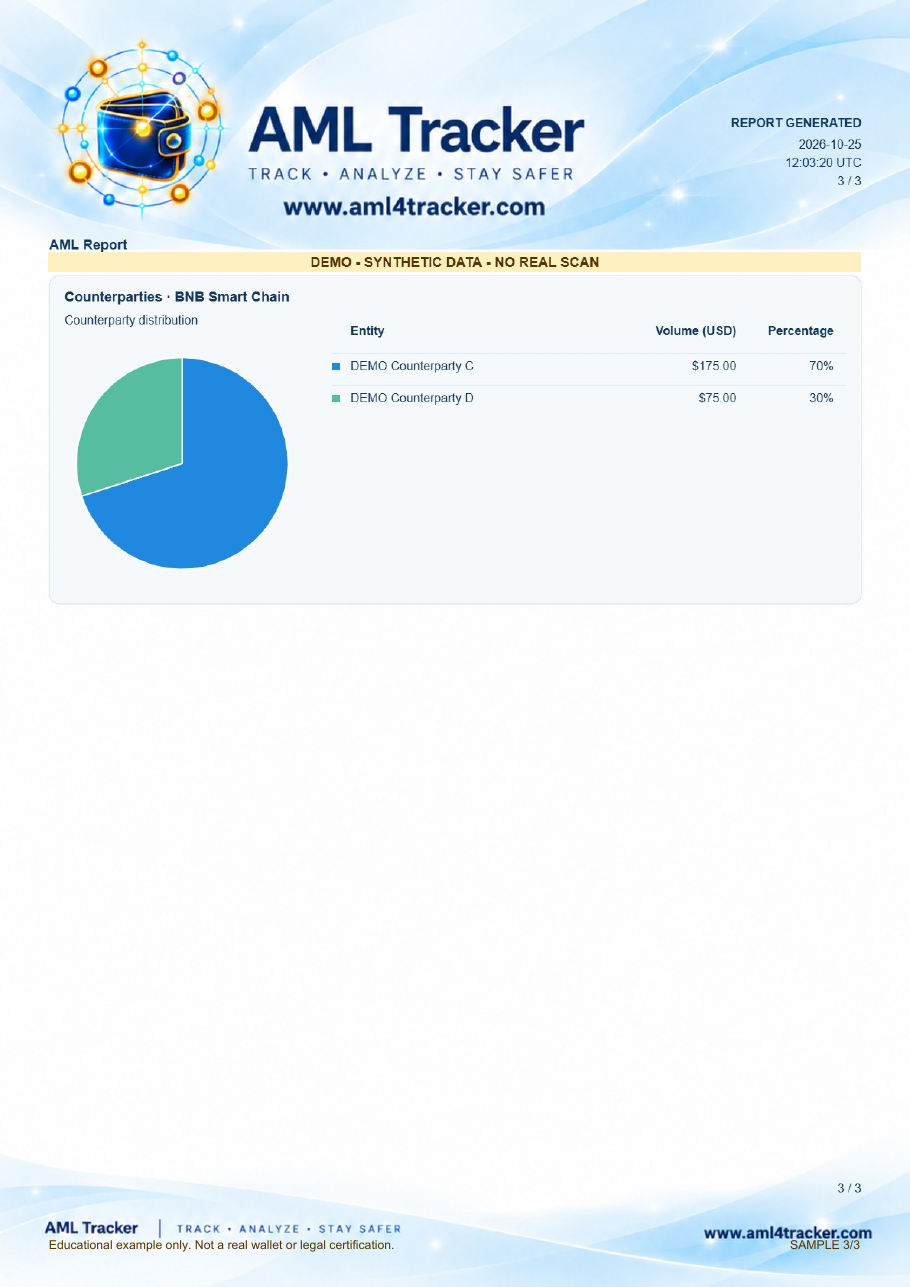
BNB Smart Chain
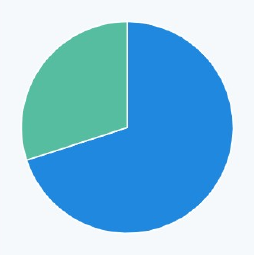
| Entity | Volume (USD) | Reported percentage |
|---|---|---|
| DEMO Counterparty C | $175.00 | 70% |
| DEMO Counterparty D | $75.00 | 30% |
| Sum of reported percentages | 100% | |
Each network has a separate table and chart showing fictional entity labels, USD volume and reported percentage. The basis for calculating these percentages is unknown; do not interpret them as a share of money or transaction count. Ethereum's displayed percentages total 90%; no invented Other row fills the gap, and the missing 10% is not evidence of risk or safety.
Terms used in this example
- Risk score:
- A risk score is not a probability of crime.
- Risk exposure:
- Exposure describes a reported connection, not proof of wrongdoing.
- Counterparty:
- A counterparty label does not verify the identity of an address owner.
- Complete:
- Required responses were available; this does not mean full history or universal data coverage.
- Hops:
- A source-reported count, not necessarily the number of intermediate addresses or verified transfers.
- Verified asset value:
- Technical asset identification and available pricing, not proof of ownership or lawful provenance.
What the PDF is useful for
It preserves the settled report for later review and sharing without rerunning a scan. Export uses the already available report and charts; it does not request new blockchain or provider data. Saved output can become outdated and should be read with its scan time.
What it cannot prove
A complete report means the required responses were available, not universal coverage. Missing data or an empty list is not proof of a clean wallet. This is not a legal certificate, an ownership check or a guarantee about funds. The report body is image-based PDF, not searchable accessible text; the HTML explanations on this page remain available without JavaScript. Current report scope is TRON or Ethereum plus BNB Smart Chain; this particular example illustrates EVM only.
The actual sample pages
View the three full report pages (optional)
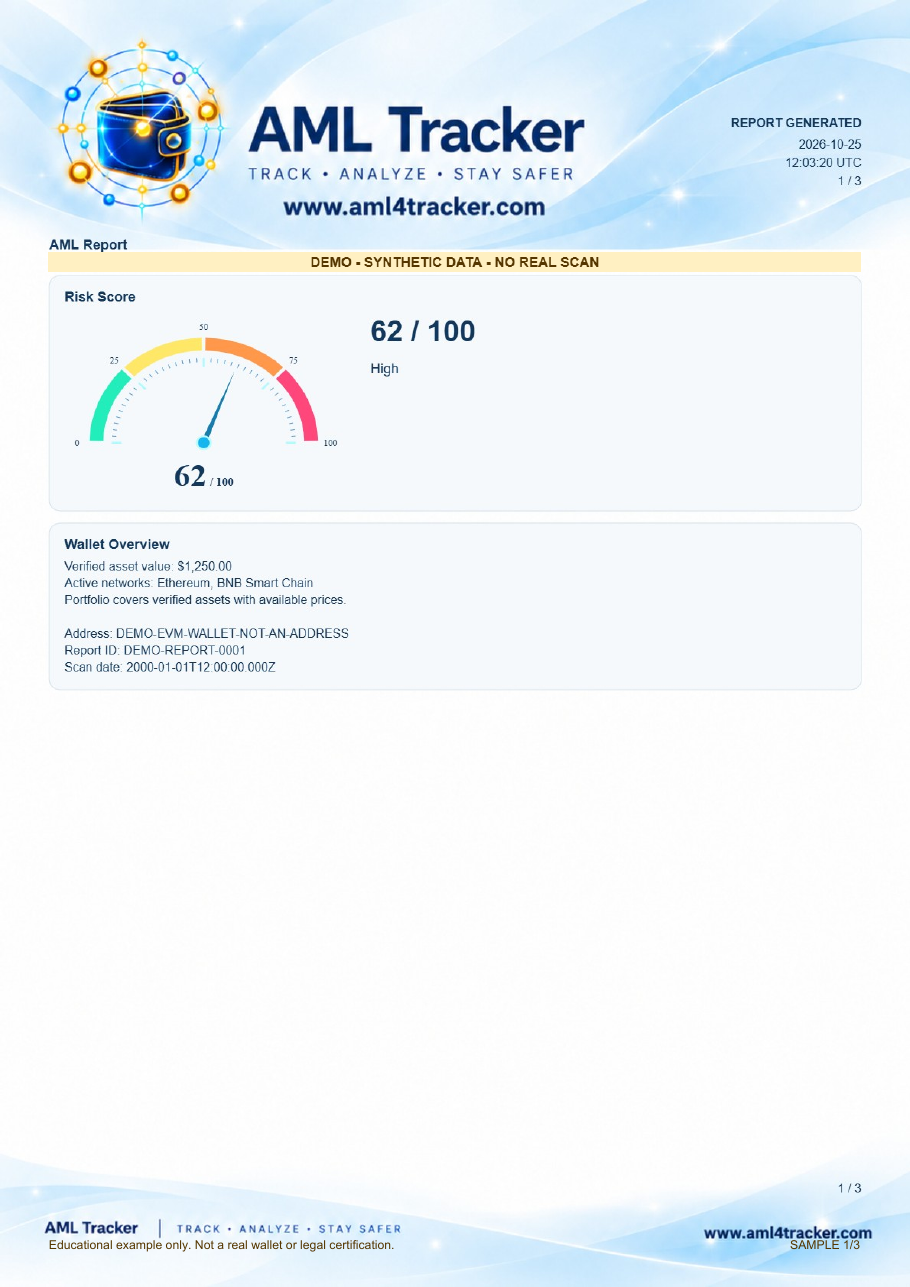
Synthetic educational sample. No real wallet scan or account connection.
Related reading
Put the explanation in context
Open AML4Tracker, the wallet risk screening application, and follow its normal account and scan process. Check current availability and commercial terms in the application.
Check your wallet now